

●●● phase diagrams in the PAULING FILE
The Phase Diagrams section of the PAULING FILE contains temperature-composition phase diagrams for binary systems, as well as horizontal and vertical sections and liquidus/solidus projections for ternary systems. Both experimentally determined and calculated diagrams are taken into consideration. All the diagrams have been redrawn in a standardized version in at.% and °C, with single-phase fields in blue and three-phase fields in yellow. The phases are named according to PAULING FILE conventions (which enables internal links to the other sections of the database), whereas the original names are stored in tables. Since 2014 also phase diagrams for multinary systems (> 3 chemical elements) are processed.
●● examples
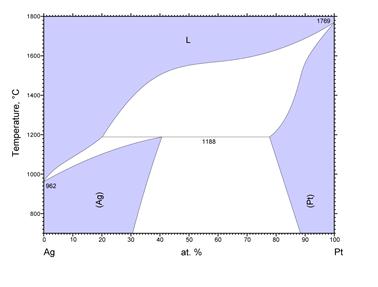
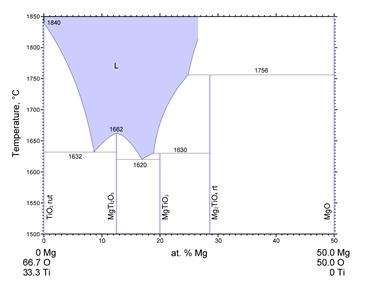
| phase diagram of a binary system | vertical section of the phase diagram of a ternary system |
|
|
|
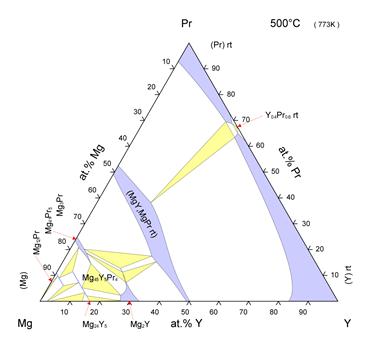
isothermal section of the phase diagram of a ternary system |
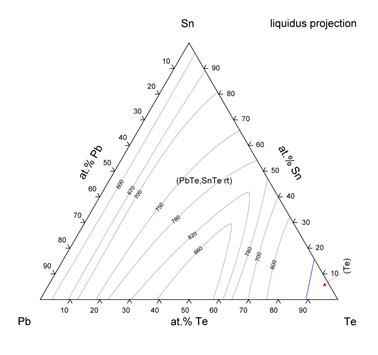
liquidus projection of the phase diagram of a ternary system |
|
|
●●● statistics
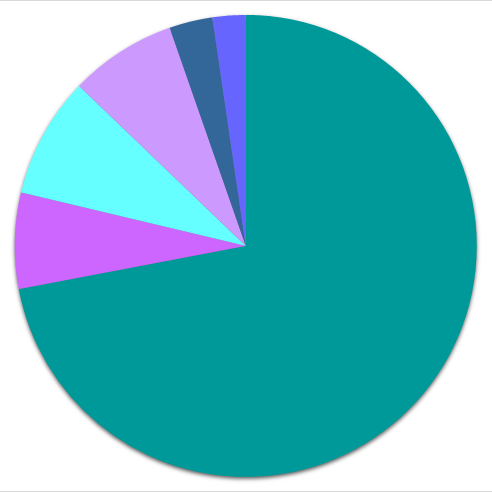
●● distribution according to literature source
 |
● Handbooks | |
| |
Massalski T.B.: Binary Alloy Phase Diagrams | |
| |
Petzow G.: Ternary Alloys | |
| |
others | |
| ● Journals | ||
| |
Russian Journal of Inorganic Chemistry | |
| |
Journal of Alloys and Compounds | |
| |
CALPHAD | |
| |
Journal of Phase Equilibria | |
| |
Zeitschrift für Metallkunde | |
| |
Inorganic Materials | |
| |
Russian Metallurgy | |
| |
Metallurgical Transactions | |
| |
Journal of the American Ceramic Society | |
| |
Zeitschrift für Anorganische und Allgemeine Chemie | |
| |
others | |
| 27'355 publications processed 01.01.2023 | ||
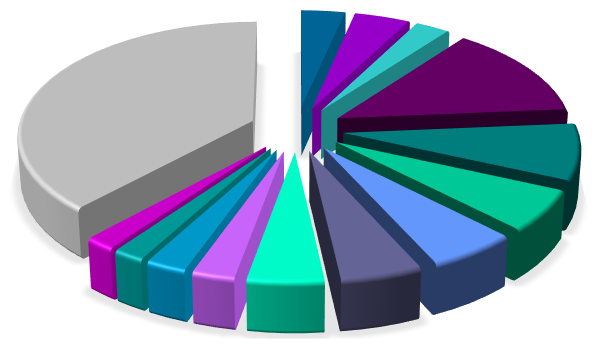
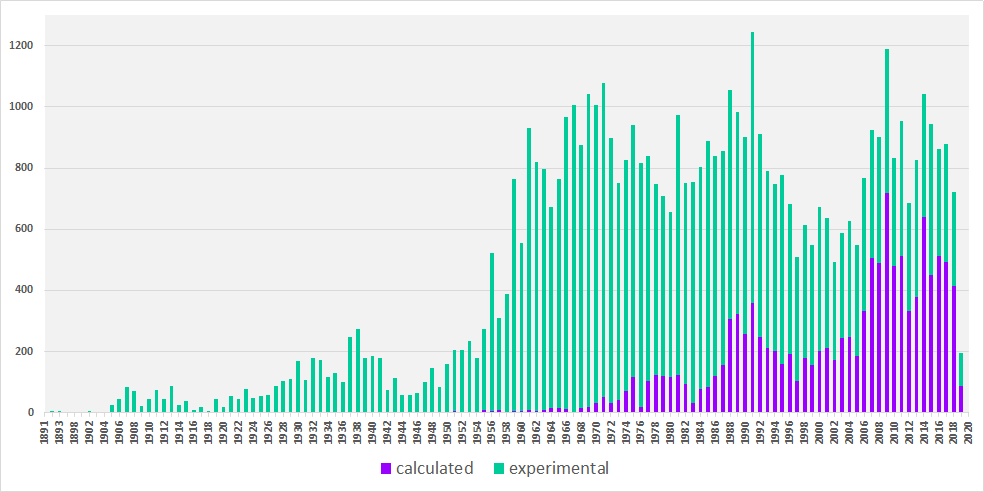
●● distribution according to publication year
●● distribution according to chemical class
| ● 2 chemical elements | ● 3 chemical elements | ● 4 and more chemical elements | |
 12'647 |
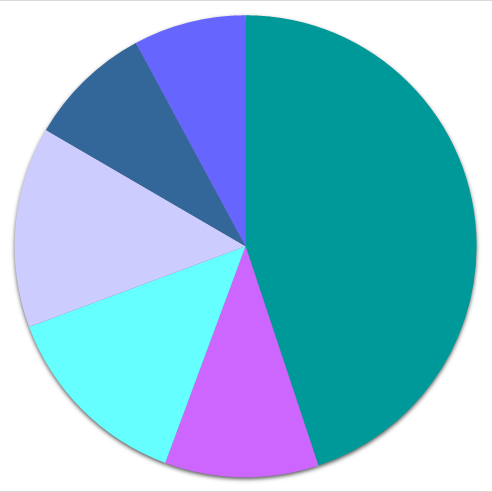 37'167 |
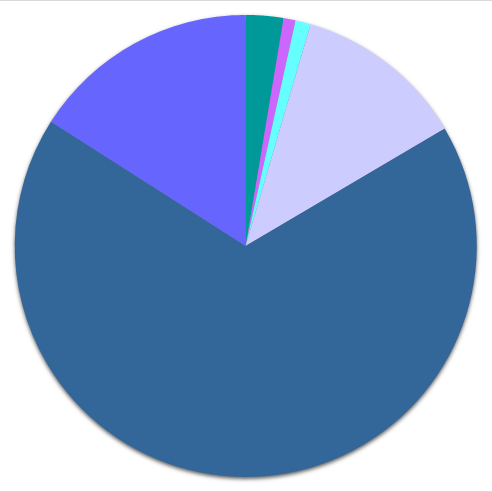 12'679 |
|
●●● selected phase diagrams
| ●● select a binary system | ●● select a ternary system |
●●● terminology
All substances exist in gaseous, liquid, or solid form (usually referred to as a phase), depending on the conditions of state. State variables include composition, temperature, pressure, magnetic field, electrostatic field, gravitational field, and so on. The term "phase" refers to the region of space occupied by a physically homogeneous material. However, there are two uses of the term: the strict sense normally used by specialists in thermodynamics and the somewhat looser sense normally used by materials engineers.
In the strictest sense, "homogeneous" means that the physical properties throughout the region of space occupied by the phase are absolutely identical, and any change in condition of state, no matter how small, will result in a different phase. For example, a sample of solid metal with an apparently homogeneous appearance is not truly a single-phase material, because the pressure condition varies in the sample due to its own weight in the gravitational field.
In a phase diagram, however, each single-phase field is usually given a single label, and engineers often find it convenient to use this label to refer to all the materials lying within the field, regardless of how much the physical properties of the materials continuously change from one part of the field to another. This means that in engineering practice, the distinction between the terms "phase" and "phase field" is seldom made, and all materials having the same name are referred to as the same phase.
In the PAULING FILE the term "phase" is in a first approach defined by the chemical system and the crystal structure.
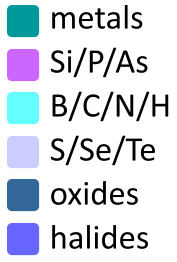
There are three types of equilibria: stable, metastable, and unstable. These three conditions
are illustrated below in a mechanical sense: (a) stable, (b) metastable, (c) unstable.
Stable equilibrium exists when the object is in its lowest energy condition; metastable equilibrium exists when additional energy must be introduced before the object can reach true stability; unstable equilibrium exists when no additional energy is needed before reaching metastability or stability. Although true stable equilibrium conditions seldom exist, the study of the equilibrium system is extremely valuable, since it constitutes a limiting condition from which actual conditions can be estimated.
The structure of solid elements and compounds under stable equilibrium conditions is crystalline, and the crystal structure of each is unique. Some elements and compounds, however, are polymorphic (multishaped); that is, their structure transforms from one crystal structure to another with changes in temperatures. The term allotropy (existing in another form) is usually used to describe polymorphic changes in chemical elements.
Under some conditions, metastable crystal structures can form instead of the stable structure. Rapid freezing is a common method of producing metastable structures, but some (such as Fe3C, or cementite) are produced at moderately slow cooling rates. With extremely rapid freezing, even thermodynamically unstable structures (such as amorphous metal glasses) can be produced.
A physical system consists of a substance (or group of substances) that is isolated from its surroundings, a concept used to facilitate study of the effects of conditions of state. "Isolated" means that there is no interchange of mass between the substance and its surroundings. The substances in alloy systems, for example, might be two metals, such as copper and zinc; a metal and a nonmetal, such as iron and carbon, a metal and an intermetallic compound, such as iron and cementite; or several metals such as aluminum, magnesium, and manganese. These substances constitute the components bordering the system and should not be confused with the various phases found within the system. A system, however, can also consist of a single component such as an element or compound.
In order to record and visualize the result of studying the effect of state variables on a system, diagrams were introduced to show the relationships between the various phases that appear within the system under equilibrium conditions. The diagrams are variously called constitutional diagrams, equilibrium diagrams, or phase diagrams. A single-component phase diagram can simply be a one- or two-dimensional plot showing the phase change in the substance as temperature and/or pressure change. Most diagrams, however, are two- or three-dimensional plots describing the phase relationships in systems made up of two or more components, and these usually contain fields (areas) consisting of mixed-phase fields, as well as single-phase fields.
The phase rule, first announced by J. Willard Gibbs in 1876, relates the physical state of a mixture to the number of constituents in the system and to its conditions. It was also Gibbs who first referred to each homogeneous region in a system by the term "phase". When pressure and temperature are the state variables, the rule can be written as follows: f = c - p + 2, where f is the number of independent variables (called degrees of freedom), c is the number of components, and p is the number of stable phases in the system.
If a system being considered is bordered by two components, the system is called a binary system. Most metallurgical problems are only concerned with a fixed pressure of 1 atm, and the phase diagram is expressed by a two-dimensional plot of temperature and composition. The Gibbs phase rule applies to all states of matter (solid, liquid, and gaseous), but when the effect of pressure is constant, the rule reduces to: f = c − p + 1.
The stable equilibria for binary systems are summarized as follows:
| number of components | number of phases | degree of freedom | equilibrium |
| 2 | 3 | 0 | invariant |
| 2 | 2 | 1 | univariant |
| 2 | 1 | 2 | bivariant |
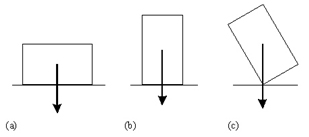
Many systems are bordered by components having the same crystal structure and the components of some of these systems are completely miscible (completely soluble in each other) in the solid form, forming a continuous solid solution. When this occurs in a binary system, the phase diagram usually has the general appearance of that shown below.
The diagram consists of two single-phase fields separated by a two-phase field. The boundary between the liquid field and the two-phase field is called the liquidus; that between the two-phase field and the solid field is the solidus. In general, a liquidus is the locus of points in a phase diagram representing the temperatures at which alloys of the various compositions of the system begin to freeze on cooling or finish melting on heating; a solidus is the locus of points representing the temperatures at which the various alloys finish freezing on cooling or begin melting on heating. The phases in equilibrium across the two-phase field (the liquid and solid solutions) are called conjugate phases.
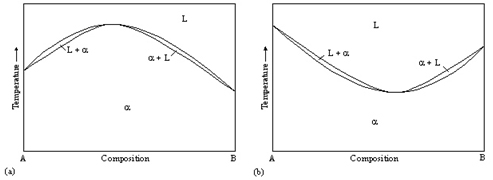
If the solidus and liquidus meet tangentially at some point, a maximum (a) or minimum (b) is produced in the two-phase field, splitting it into two portions, as shown above. It is also possible to have a gap in miscibility in a single-phase field; this is shown below.
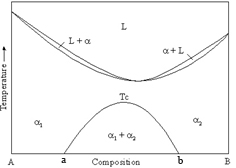
Point Tc, above which the phases α1 and α2 become indistinguishable, is a critical point. Lines a-Tc and b-Tc, called solvus lines, indicate the limits of solubility of component B in A and A in B, respectively. The configuration of these and all other phase diagrams depends on the thermodynamics of the system.
If the two-phase field in the solid region is expanded so that it touches the solidus at some point, as shown below (a), complete miscibility of the components is lost. Instead of a single solid phase, the diagram now shows two separate solid terminal phases, which are in three-phase equilibrium with the liquid at point P, an invariant point that occurred by coincidence.
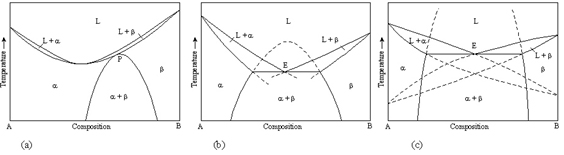
Then, if this two-phase field in the solid region is even further widened so that the solvus lines no longer touch at the invariant point, the diagram passes through a series of configurations, finally taking on the more familiar shape shown in (b). The three-phase reaction that takes place at the invariant point E, where the liquid phase freezes into a mixture of two solid phases, is called a eutectic reaction (from the Greek word of "easily melted"). The alloy that corresponds to the eutectic composition is called a eutectic alloy. An alloy having a composition to the left of the eutectic point is called a hypoeutectic alloy (from the Greek word for "less than"); an alloy to the right is a hypereutectic alloy (meaning "greater than"). In the eutectic system described above, the two components of the system have the same crystal structure. This, and other factors, allows complete miscibility between them. Eutectic systems, however, can also be formed by two components having different crystal structures. When this occurs, the liquidus and solidus curves (and their extensions into the two-phase field) for each of the terminal phases (c) resemble those for the situation of complete miscibility between system components.
In figure (c) above, dashed lines indicate the portions of the liquidus and solidus lines that disappear into the two-phase solid region. These dashed lines represent valuable information, as they indicate a condition that would exist under metastable equilibrium; such might theoretically occur during extremely rapid cooling.
Reactions involving three conjugate phases are not limited to the eutectic reaction. For example, upon cooling, a single solid phase can change into a mixture of two new solid phases or, conversely, two solid phases can react to form a single new phase. These and the other various types of invariant reactions observed in binary systems are illustrated in a schematic phase diagram including various types of invariant reactions observed in binary systems, such as homotectic, catatectic, monotectic, peritectic, syntectic, monotectoid, peritectoid, and eutectoid.
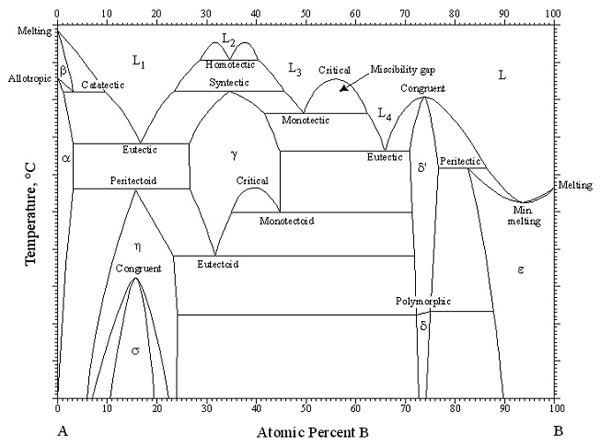
In addition to the three solid terminal phases, the diagram shown above displays five other solid phase fields at intermediate compositions. Such phases are called intermediate phases. Many intermediate phases, such as those illustrated above, have fairly wide range of homogeneity. However, many other have very limited or no significant homogeneity range.
When an intermediate phase of limited (or no) homogeneity range is located at or near a specific ratio of component elements that reflects the "normal" positioning of the component atoms in the crystal structure of the phase, it is often called a compound (or line compound). When the components of the system are metallic, such an intermediate phase is often called an intermetallic compound.
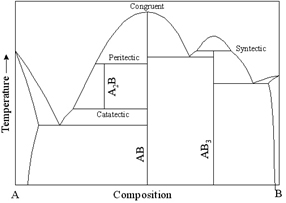
In the schematic diagram shown above, an alloy of composition AB will freeze and melt isothermally, without the liquid or solid phases undergoing changes in composition; such a phase change is called congruent. All other reactions are incongruent; that is, two phases are formed from one phase on melting. Congruent and incongruent phase changes, however, are not limited to line compounds.
MPDS 2023